Pinewood Nerdy
Wood cars. An aluminum track. And lots of data.
I was not sure what to expect when my son wanted to sign up for cub scouts. But I knew, at some point, Pinewood Derby would come into the picture.
The moment came. He built a car. He raced it. And it was just as awesome as we had hoped. With so much creativity and hands-on crafting, followed by actual racing, it’s a tough experience to top.
Then I saw the data being recorded by the digital track. Now it was my turn to have some fun.
Pinewood 101
For the uninitiated, the Pinewood Derby is pretty basic: Each scout starts with a block of pine wood, four wheels, and some axles.
The block of pine can be carved, painted, and adorned with simple add-ons (picture Lego characters glued atop). But in their simplest terms, the rules dictate that you cannot modify the wheels, add any kind of propulsion, and after all modifications the car cannot exceed 5.0 ounces. You can find a ton of great info on optimizing a pinewood derby car on YouTube, so I won’t go into that here.
Once completed, the cars are placed on a sloped track where they race against three other cars at a time.
To create his car, my son chose a simple Minecraft creeper design. With a coping saw, some paint, and lead weights in hand, we got to work.
Sounds easy enough, right? It mostly is. But what really fascinates me is the sophistication of modern Pinewood Derby tracks. A digital timer automatically records the time of each racer and their car, the cars’ place in each heat, the lane each car is in, and all of this gets stored in a database. With enough associated data and numerous individual races throughout a day, there’s a lot of data to dig into.
What follows is just the tip of the iceberg. These brief statistics provide a cursory glance at data that some of the older scouts might enjoy.
The Speed of Pinewood Derby Cars
How fast do these things go, anyway? The distribution plot below shows a range of speeds from 177 mph to 229 mph, with most cars exceeding 200 mph.
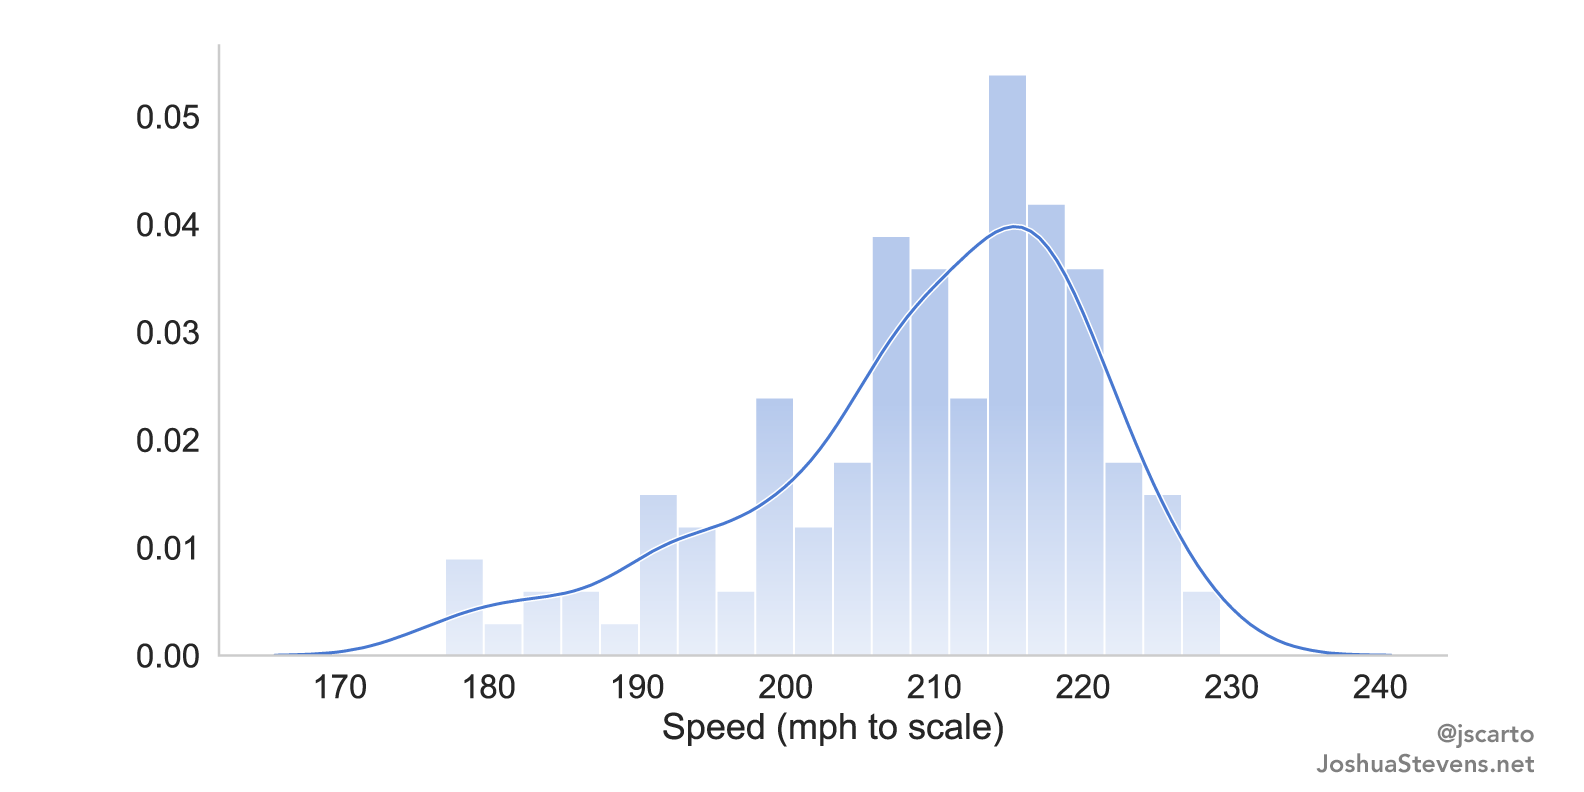
200 mph?! Well… yes. But no. The speeds recorded by the track are scaled to simulate the speeds of a normal sized car. The actual speeds hover around a more modest 10 mph.
These speeds represent a car’s average across the track too, so they do not tell the whole story. An individual car’s speed will vary from the start of the race to the finish. Due to the curvature of the track and variation among car designs, some cars will excel at the downhill section and underperform on the flat. Others might carry their speed the whole way through. Such variation across the track is not recorded (yet).
Time is Everything
Time is what really matters. As the great Ricky Bobby said: “If you ain’t first, you’re last!“
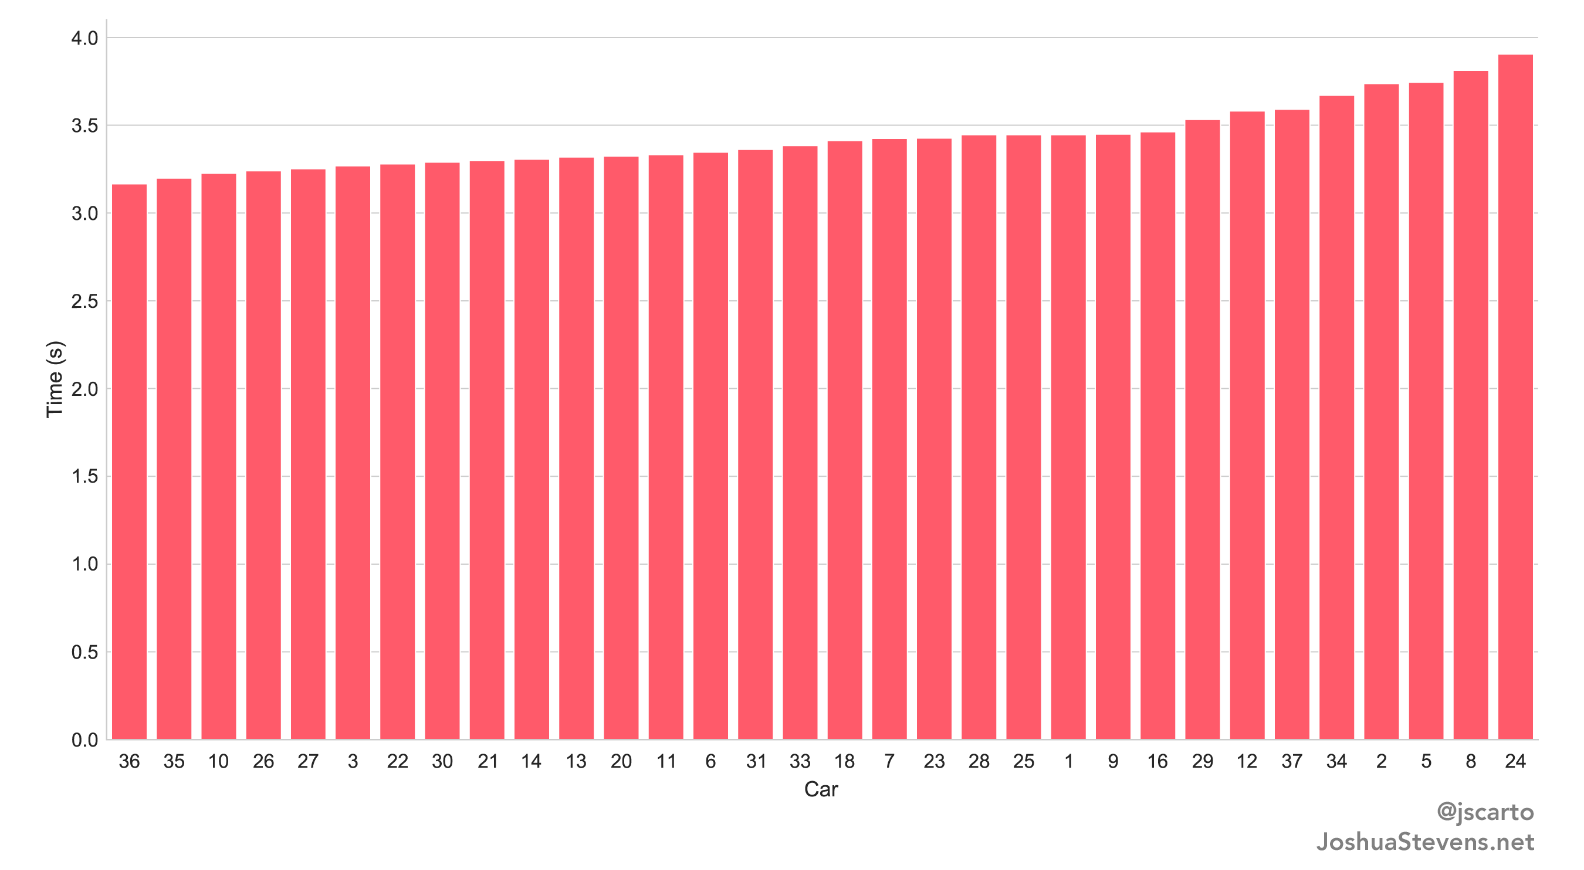
Below is a chart of the average times for each racer. For anonymity, car numbers are shown instead of scout names.
Viewed in these terms, it doesn’t look like there is a lot of variation to get excited about.
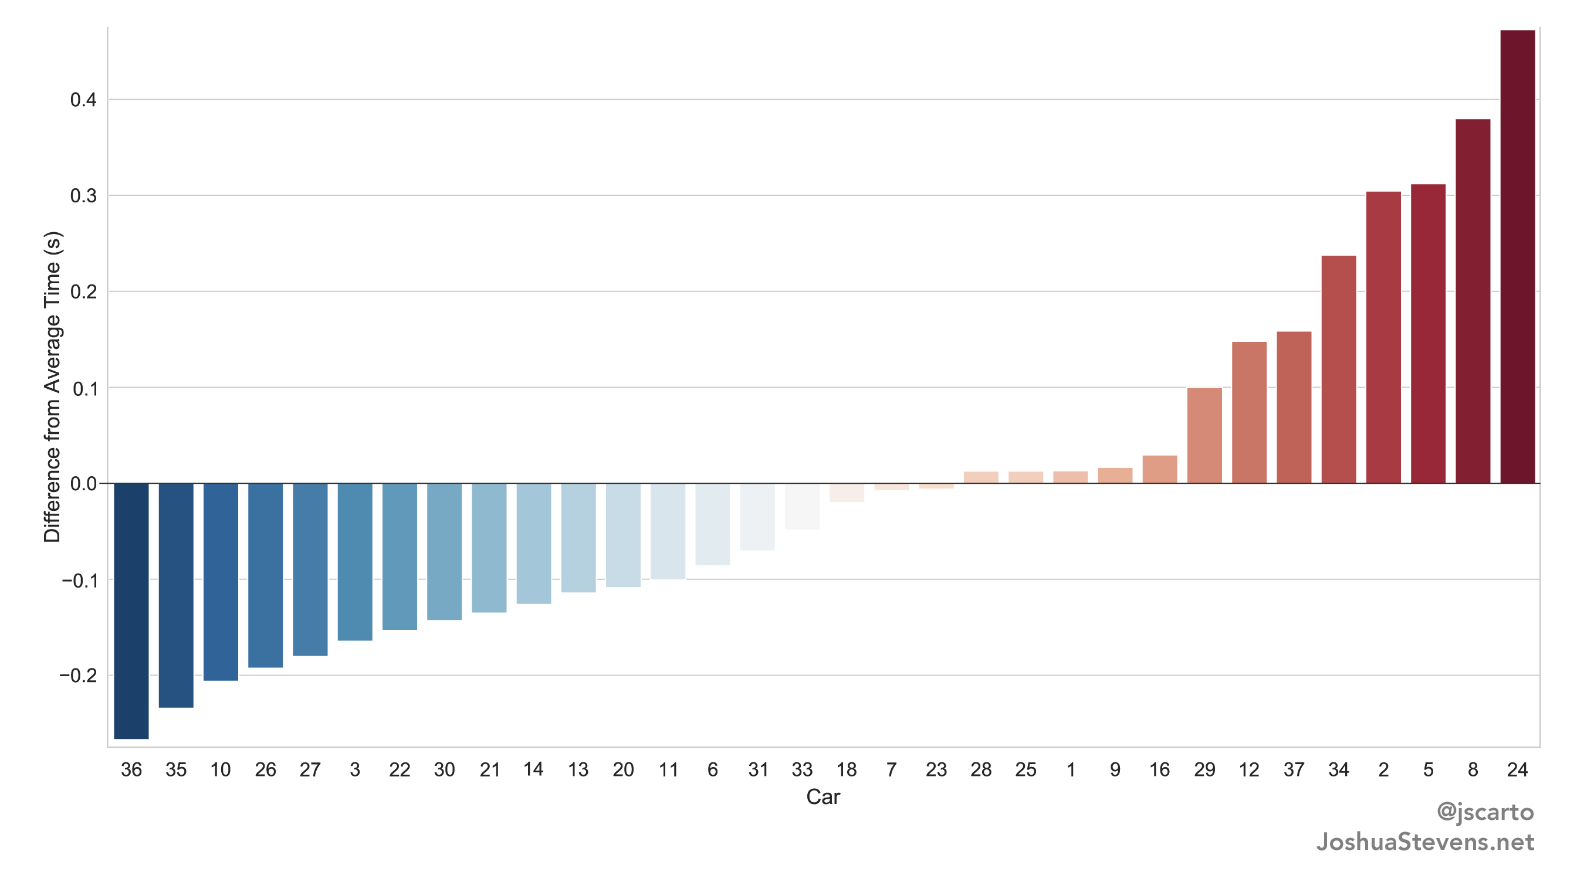
A more interesting and meaningful view shows how each racer performed against the derby average.
Racers aren’t competing against the average, however. They’re trying to win 1st place. The following chart shows how close each racer came to that goal.
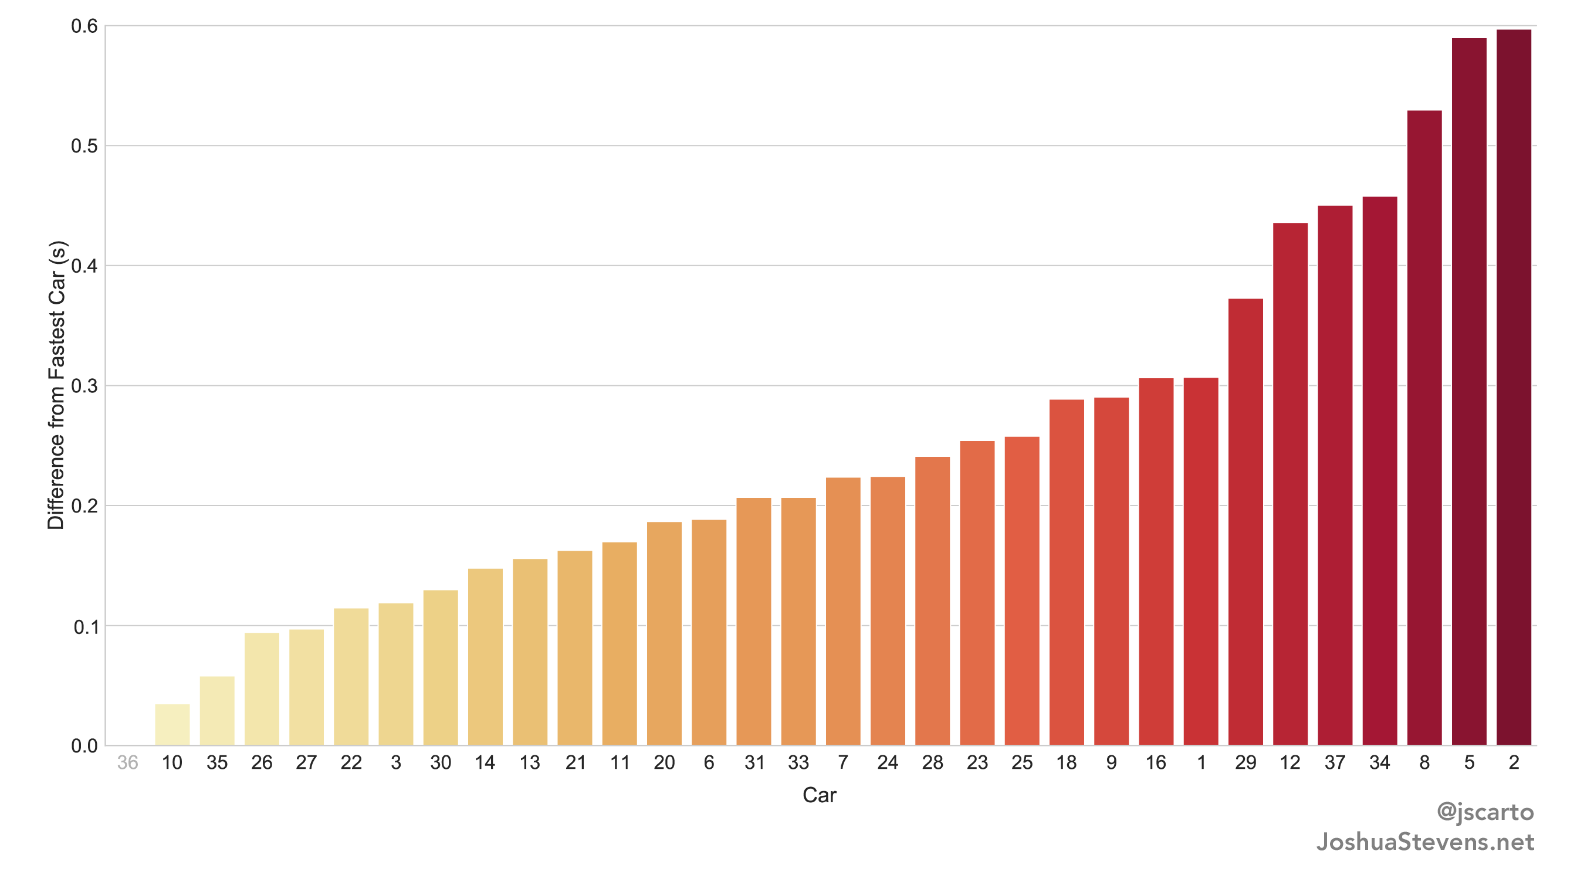
Six tenths of a second. That is all that separates the slowest car from the fastest! Most of the competitive action happens within a quarter of a second. That’s amazing. It also shows the true value of seemingly minor considerations like where to place weights and reducing as much friction as possible.
The Big Kids Dominate, Right?
As I helped my son cut, sand, and shape his block of pine I became really curious. Will this kindergartener-cut-car be competitive against those made by much older kids?
Surely the Webelos and Arrow of Light dens full of 4th-graders would have an advantage.
As it turns out, that isn’t the case at all.
On average, each den performed similarly well. The plot below shows the spread of times across each den. The averages are incredibly close, and there is not a statistically significant relationship between time and den (F = 1.26, p=0.29).
Notice anything in the plot above? While most dens are associated with a large range of times, the Wolves demonstrate a much tighter grouping without any outliers. All of their cars, across all heats, performed remarkably alike.
I suspect this is the result of having team-based work sessions in which the Wolves designed and built their cars in a group setting. While all of their cars were different, similar design strategies may have been discussed and employed. That’s pretty awesome! Teamwork is what scouting is all about.
If my guess is right, the Wolves set an example to be followed in this year’s derby - so much so that it shows up in the data!