Mapping Tools – Analysis and Visualization of Spatial Data
I had the pleasure of being invited to talk about mapping tools at the Hacking Science Hands on Sessions, led by professor and tech enthusiast Marcel Salathé.
“Mapping tools” is a pretty broad topic and it’s impossible to cover the whole scope of cartography, GIScience, and the suite of existing software in a single hour. So I took attendants on a whirlwind tour of tools, both open source and not, highlighting the strengths and weaknesses of each. Among those showcased were Esri ArcGIS, QGIS, R, TileMill, CartoDB, PostGIS, D3, Leaflet, and more.
Following an introduction of various tools and their capabilities, I led a hands-on demo of CartoDB and introduced CartoCSS. During the demo we mapped over 1,200 automobile accidents in Pennsylvania (screen shot below).
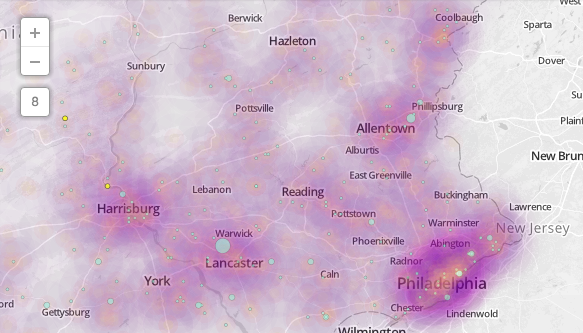
Since styling, variable selection, and simple definition queries can all be done with CartoCSS, it’s a great tool for those new to cartography to master. In the talk I demonstrated how CartoCSS can be used to employ scale-dependent visualizations that update as users zoom in or out of the map. For example, heat maps work very well when many events are clustered together, but are not ideal at large scales when clusters become dispersed and individual points should be emphasized.
In modern web mapping, CartoCSS is the gateway drug to more complex queries and styling that will (I hope) lead the curious to SQL and PostGIS.
Slides from my talk are included below.
If you’d like to follow the demo, the data and CartoCSS I used is online: get the gist